


By Sophie Alvarez and Carmen Calle, respectively M&E and Communications leaders in SERVIR-Amazonia, with contributions from Mayesse da Silva, Javier Martin, Jorge Luis Sanchez, Karina Sanchez, Rodrigo Torres, Andrea Puzzi- Nicolau, and Ana María Acosta.
Photo: elvanguardistaonline.com
To end 2022 and our reporting of year four, we would like to thank our readers and all those who have supported us in reaching our goal to improve decision-making in the Amazon. We hope you understand how important it is to bring local knowledge and partners in the Amazon together with world-class science in geospatial and Earth observation technologies. Twenty-twenty-two was a fruitful year, especially because we were finally able to meet each other again in person (more than once!), meet new colleagues, and, more importantly, gain momentum on the ground with our services. Year four also saw us steadily increase our institutional influence, training close to 500 people all over the Amazon, and beyond.
We have been fortunate this past year to see some very encouraging “use cases”, that show us early, short- and medium-term outcomes, and thus are a critical indicator at SERVIR-Amazonia. They are our way of “hunting down” the story of what happens to innovations in geospatial technologies once we “hand them over”, because it is never quite as simple as that! The process of “handing over” means the institutionalization and “internalization” of the tools, data and capacity building we co-create with partners in our services. Therefore, immediate and shorter-term outcomes are “critical” to find and analyze. These changes in knowledge, skills, understanding, and practices (that can happen early) allow us to monitor in more detail the longer-term outcomes that extend to our final goal of supporting Amazon basin countries to improve decision-making and to include the voices of women, indigenous peoples, and their communities.
We write our use cases as simple stories in which “next” user groups (next user groups are our implementing or “consortium” partners who are involved in the co-creation process around our services) or an entity uses our innovations (adapted tools, dataset, maps, capacity building, and other SERVIR-Amazonia service components), and this use results in trackable outcomes. Here we present a brief look at four of the use cases in 2022, each one is a true gift for us at the SERVIR-Amazonia Program, and we present them to you as gifts. They are a glimpse into a few of the good things that are happening in our beloved Amazon. These, we hope, are examples of some of the sustainable changes we can create in our forests using our geospatial power.
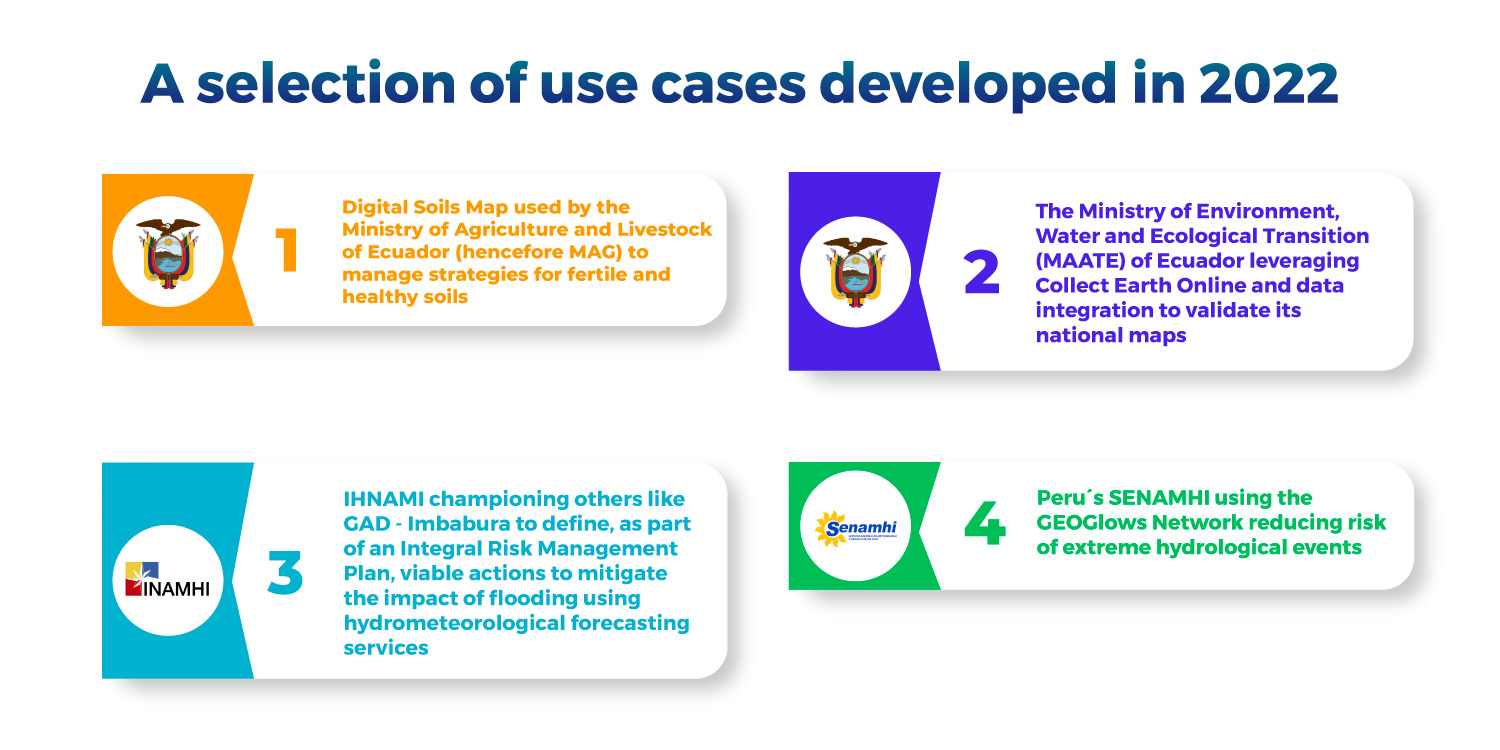
Image: SERVIR-Amazonia
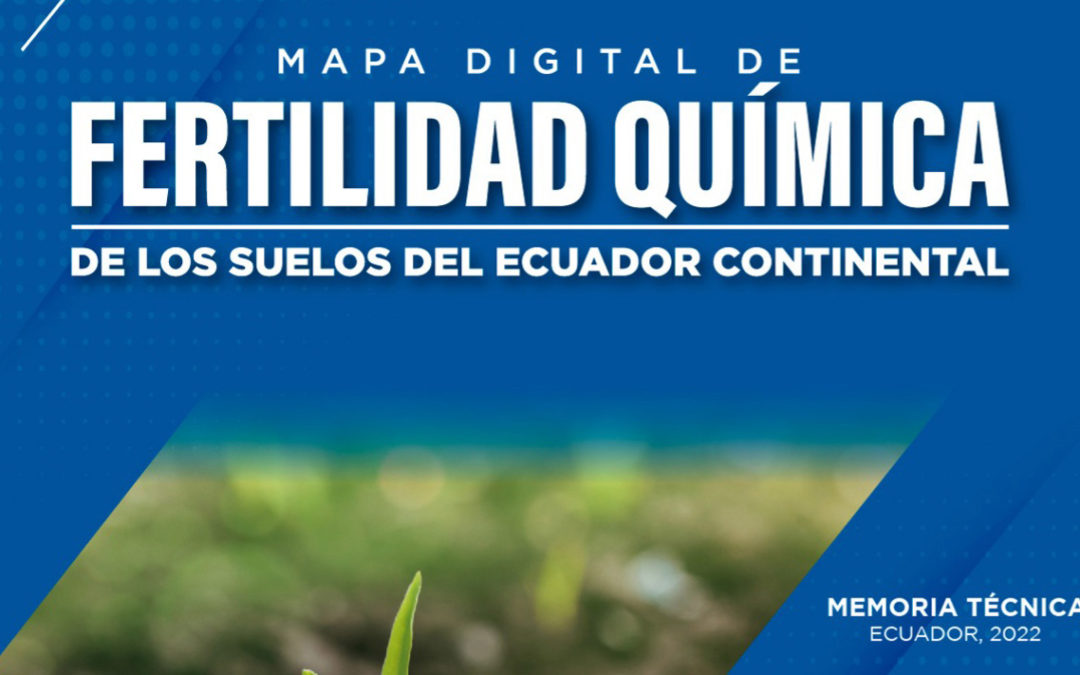
Landslide in the Ecuadorian Amazon made visible using a digital soils map
Perhaps the Use Case that had the most attention this year was the Chemical Soils Fertility Map, co-developed by the Alliance team: Mayesse da Silva, Javier Martín and Juan David Caicedo, along with Wilmer Jiménez, Oscar Calahorrano and Darwin Sánchez, who are all technical staff of the Soils and Environmental Management Units (CGINA-DGG) at the Ministry of Agriculture and Livestock of Ecuador (MAG), as well as our hub partner EcoCiencia. The map is easy to access and use and is being used by agricultural technicians, agricultural associations and government to make much better-informed decisions. It contains all the information they need in one digital map. Minister Hon. Bernardo Manzano at MAG says, “The map will contribute to identifying soil degradation, mainly caused by erosion and will be an effective tool to manage strategies that allow us to have fertile and healthy soils”.
The fertility and related soil characteristics maps were developed nationally, and originated directly from a technical request lodged by MAG in Q2 of 2020, in our second year. This case is also helping us to demonstrate one of our most common “expected outcomes flows”: (1) begins with a request from an Amazonian country, from a technical level governmental partner (MAG) to (2) then successful co-development of a response, which is a SERVIR service (3) that is used in several ways by the partner to (4) rapidly extend the service to local or regional governmental offices that are starting to use the service, in this case, the Chemical Soils Fertility Map.
As if that wasn’t exciting enough, the Digital Map: Chemical Fertility of the Soils of Continental Ecuador, won the ESRI Ecuador prize in the Map Gallery category. The prize, two ESRI licenses for ArcGIS PRO, was given to MAG partners, so that they can continue to work on GIS and spatial analysis to monitor soil erosion as a part of our next Digital Soils Map 2 Service in year five. This will be implemented by MAG with other projects in their provincial offices using GIS for the benefit of the agricultural sector in Ecuador. The winning map can be found in the Geoportal del Agro Ecuatoriano, and the prize giving event with our partner EcoCiencia can be seen on the ESRI Ecuador website.
Using Collect Earth Online to improve forest monitoring data accuracy
Staying in Ecuador, the Ministry of Environment, Water and Ecological Transition (MAATE), – through their Monitoring and Inventory of Forests Team Directorate – co-developed a service to improve forest monitoring data accuracy in the Ecuadorian Amazon with EcoCiencia and SERVIR-Amazonia. The aim of the service is to improve the living conditions of people that live in the rain forest. Accurate and easily-available forest monitoring data are needed for (1) key decision-making for conservation, restoration, and management measures, (2) contributing to the Measurement, Reporting and Verification (MRV) system reporting to the UNFCCC (United Nations Framework Convention on Climate Change) and (3) implementing climate change mitigation funds as part of the existing Socio-Bosque program and the National Action Plan for REDD+.
The innovation in this case, was 1) the increase in the speed and accuracy of data integration by centralizing it in Collect Earth Online (CEO), into a fast, comprehensive and rigorous tool, and 2) carrying out the necessary training to ensure our partner/user MAATE can make the best use of the tool: “By leveraging CEO, MAATE has the base maps, information, and tools it needs to validate its national maps in a more timely manner,” explained Ximena Herrera, Coordinator of the Monitoring and Inventory of Forests Team.
We believe that making deforestation, forest degradation and vegetation regeneration processes transparent will lead to the prevention of irregular or illegal activity in the forests by the relevant authorities, and encourage, incentivize and replicate positive practices. This use case gives us the pleasure and satisfaction of seeing that we can have better outcomes by integrating existing knowledge and projects (such as the Socio – Bosque program). We can also rapidly increase the impact and scope of our partners, rather than “reinventing the wheel”. At SERVIR-Amazonia we use examples such as MAATE to improve the adaptation of the CEO tool for different needs, so that other users will also benefit from this use case.
More Ecuadorian Champions in 2022 using our co-developed tools to predict and address disasters with Thetys
This National Institute of Meteorology and Hydrology (INAMHI) use case also came from a technical user request, and has been helpful for us in reaffirming the importance of demand-led service design. Before contacting SERVIR-Amazonia, INAMHI had no installed capacity, it did not know about the Tethys platform, and did not comply with WMO data sharing standards. In addition, they did not have sufficient budget to carry out their activities, even though it is the national institution responsible for hydro-meteorological issues. Using this service, INAMHI have improved their flood forecasting capabilities, that now include more accurate information on timing, magnitude, and the impact of floods.
The service introduced these innovative forecasting, hydrological and data visualization applications, methodologies, and tools (hosted on the Tethys platform), to academic, technical and governmental users in the region. The hydro informatics tools are also being used to support the training of local parties to understand past river flooding patterns and how the watershed integrates across political boundaries. Bolivar Erazo, Executive Director of INAMHI, said services will improve INAMHI’s capabilities to provide hydro- meteorological forecasting services in the country and will facilitate access and friendly interaction with INAMHI’s data, both for technicians and the public. “The use of the applications improves services and as an institution they will be more visible and will be able to access resources for the development of their activities.”, said Erazo.
IHNAMI is also championing others to use the tools: GAD – Imbabura is an example (GAD is the Spanish acronym for a District Government Office in Imbabura, northern Ecuador). In recent years, the area has been affected by the flooding of the Apaquí and Chota rivers. Since there are no data and therefore no flood forecasts, the population and crop production have been affected, with those living along the riverbanks being particularly at risk. With INAMHI’s authorization, the Provincial Government of Imbabura accessed applications hosted on the Tethys platform. These also include hydrological applications such as Hydroviewer, National Water Level Forecast and a Historical Validation Tool which are now being used by GAD Imbabura to define (as part of an Integral Risk Management Plan), viable actions to mitigate the impact of these types of events before they happen, directly benefiting the entire population of the province and neighboring territories.
Just like the above, in the Soils Map use case, our “bet” was that a tool (or a comprehensive package of tools), that has been developed in response to users’ needs will; (1) adapt to user´s needs and gaps and available systems and tools from the start, (2) it will be easier for other district or local offices to access and work with the tools for their own specific needs, and it will (3) increase the impacts of service time, training, financial, and investment expertise. We hope national and provincial governments in Ecuador agree it was a good bet!
Peru’s SENAMHI using GEOGloWS Network, Thetys and RAPID algorithm to improve local hydrological SONICS model and the country’s extreme hydrological events warning system
GEOGloWS launch event in Peru
Photo: Carmen Calle / SERVIR-Amazonia
Lots of snappy terms! Ambitious goals! Are you curious? Read on… Another tool developed locally was SONICS, by the National Meteorology and Hydrology Service of Peru (SENAHMI) . The SERVIR-Amazon team shared the GEOGLoWS hydrologic model’s network of rivers and watersheds and delivered training in the use of the RAPID algorithm, for transacting runoff values and calculating flows in each river of the network. SENAHMI was initially introduced to the development and operation of the GEOGloWS ECMWF Streamflow Services global hydrologic model. They found that the runoff to streamflow transformation method used by the global model could be used by their local SONICS model. The delineation of the drainage network and sub-basins of the GEOGloWS model for Peru were shared with SENAHMI and training in the use of SONICS was carried out with SENAHMI staff. After the training, SENAHMI began using the RAPID model for its SONICS model to produce streamflow forecasts over a drainage network and sub-basins identical to that of the GEOGloWS model. In addition, a web application has been developed to query, visualize and download the SONICS model data.
This local needs-driven solution improved the local SONICS model and according to Harold Omar Llauca Soto of the Subdirectorate of Hydrological Studies and Investigations at SENAHMI, “the application of the RAPID algorithm facilitated simulation on a national scale of more than 12,000 stretches of river. Thanks to enhancement of the SONICS model, it is now possible to estimate the time series of daily flows in large basins in a dynamic and interactive way across Peru, instead of the old static map”. The ultimate objective of this enhanced system is to use the web application to generate flood alerts based on predicted flow values, which is the work currently being carried out. Once development is complete, the application can anticipate floods at least one day in advance across Peru, enabling actors to act fast.
In summary each of these interactions with users about the solutions we wish to co-develop with them for the Amazon, is a gift to us. They allow us to understand how to better harness the power of geospatial tools and technologies to improve decision-making at all levels in the region. Our greatest wish for 2023 is to be able to keep scaling and expanding these positive experiences that are helping us in the fight against climate change and all the other natural disasters our beloved Amazon and its peoples face. More than 30 million people that depend directly on this forest, and the billions that depend indirectly on its eco-systemic services, need us to stop the illegal use of the Amazon now.
Thanks partners and all Amazon and earth and space lovers for being with us… Happy Holidays!… and let’s stay positive, using geospatial technology to save the forest!